Jan 8, 2018
By: Mark Zandi, Chief Economist, Moody’s Analytics
Republished with permission from Credit Research Foundation
Overview
- The pace of growth remains firmly above the economy’s potential.
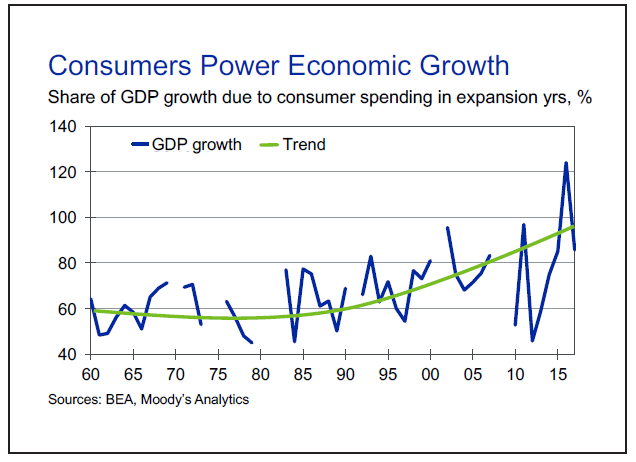
- Consumers have been the strongest and most consistent source of growth in the current economic expansion.
- The increase in household wealth has been stunning as stock and house prices have surged.
- With the Fed now winding down its quantitative easing and the prospects for higher interest rates, risks are rising that asset prices will come under pressure, and the wealth effect fades.
The U.S. expansion continues to power forward. Abstracting from the near-term ups and downs in the data, real GDP growth remains just above 2% and job growth at over 2 million per year. This is about the growth experienced since the expansion began 8½ years ago.
The pace of growth remains firmly above the economy’s potential, and any underutilized resources are being quickly absorbed. Unemployment at just over 4% and underemployment—a broader measure of slack in the job market—at less than 8% are consistent with an economy operating beyond full employment. The last time the job market was this tight was at the peak of the technology boom around Y2K.

Manufacturing utilization rates have also hit a new cyclical high, and while they aren’t as high as in previous cycles, this has to do with the shifting makeup of the nation’s manufacturing base and measurement issues. Aside from high-end multifamily properties, for which new construction has boomed, vacancy rates in real estate markets are also very low. The overall housing vacancy rate, including both homeowner and rental vacancy, is as low as it has been in 30 years.
Wage and price pressures have been slow to build, despite the tightening markets, but this is changing. Wage growth is accelerating and is closing in on 3%. Producer prices are rebounding, and single-family rental rates are up strongly. Consumer price inflation has yet to revive, but that seems only a matter of time.
Christmas cheer
The next test for the economy will be the strength of the Christmas buying season. Consumers have been the strongest and most consistent source of growth in the current economic expansion, accounting for nearly three-fourths of the economy’s growth. They show no sign of letting up this Christmas.
In addition to the very strong job market, consumers are being buoyed by their solid balance sheets. They have deleveraged. Total household debt outstanding has recently hit a new high, but it has been a decade since the previous high, and incomes are much higher. The household debt-to-income ratio is close to a quarter-century low and is stable.
More important, the proportion of after-tax income that households must use to make payments and remain current on their debts has never been lower in the 35 years of available data. Most households have also insulated themselves from rising interest rates by refinancing into long-term fixed-rate mortgages, on which the average coupon is only 4%. A record low one-fifth of household debt has an interest rate that adjusts within a year of a change in market rates.
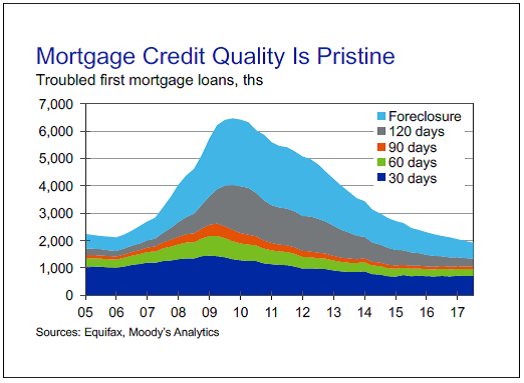
Credit quality on mortgage and consumer loans is about as good as it has ever been. Mortgage delinquency rates have never been lower, and while credit card delinquency rates are rising, they are still low by any historical standard, and the recent increase simply reflects a normalization of credit conditions.

In response to the good credit conditions, lenders have eased up on their standards and credit is flowing freely. Credit- and retail-card lending is back to normal, as is consumer finance lending. Even home-equity lending has come back to life, as higher house prices have increased homeowners’ equity and lenders are more comfortable extending loans, given much-improved credit quality.
It is also easier to qualify for a first mortgage loan to refinance and purchase a home, although standards are still a bit tight compared with pre-housing bubble historical norms. The only exception is vehicle lending, as vehicle lenders have responded to a weakening in credit quality and have tightened their standards, contributing to the recent slowing in vehicle lending and sales.

Wealth supercharger
Supercharging consumer spending during this expansion has been the wealth effect. This goes to both the rapid rise in asset prices and the sensitivity of households’ willingness and ability to spend in response to changes in their wealth.
The increase in household wealth has been stunning as stock and house prices have surged. Since their bottom near the nadir of the Great Recession in early 2009, stock prices have rocketed higher. Based on the Wilshire 5000, the value of all publicly traded stocks has risen from $7.5 trillion to $26 trillion currently. Over the past 18 months, since the last significant correction in the stock market, they are up close to 30%, equal to an increase in stock wealth of more than $6 trillion.
The revival in house values has also been impressive. House prices hit bottom in early 2012, after a long painful 30% crash in prices during the housing bust. Since then prices have fully recovered and are at record highs. The value of housing owned by households has risen from a low of not quite $16 trillion to about $24 trillion currently. Over the past 18 months, house prices are up almost 10%, equal to an increase in housing wealth of close to $2 trillion.
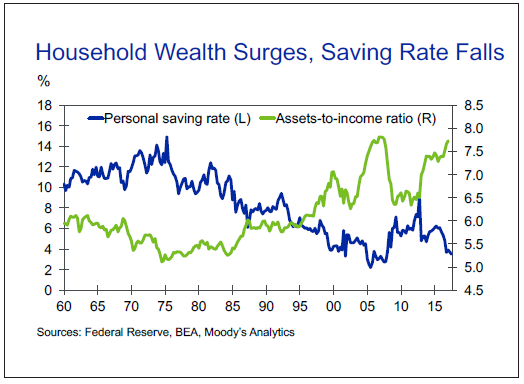
The impact of changes in household wealth on consumer spending is evident in the strong inverse relationship between wealth and the personal saving rate.
The simple correlation coefficient between the ratio of household assets to disposable income and the personal saving rate over the past more than 50 years is a very strong negative 0.84. That is, rising asset values is associated with declining personal saving, and thus more consumer spending.
That the relationship remains very strong today is clear in that over the past five years, during which the assets-to-disposable income ratio has surged close to a record high, the personal saving rate has been halved from 7% to its current 3.5%. The only other time the personal saving rate was lower than it is today was back during the housing bubble in the mid-2000s.
Based on econometric analysis, we estimate that the wealth effect on total consumer spending is 4.5 cents. That is, for every $1 change in household wealth, consumer spending ultimately changes by 4.5 cents. More than one-fifth of the growth in consumer spending during the current economic expansion, and closer to half the spending over the past year is thus due to the wealth effect. Wealth effects peak one year after a change in wealth, and they are asymmetric— larger when asset prices are falling than when prices are rising.
Wealth threat
This highlights the significant support the Federal Reserve’s quantitative easing (QE) program has provided the current economic expansion. One of the principal channels through which QE and resulting lower long-term interest rates impact the real economy is through higher asset prices and the resulting wealth effects. At its peak impact in late 2013, QE reduced 10-year Treasury yields by approximately 100 basis points, lifting stock prices by over 15% and house prices by almost 10%. Doing the arithmetic, the Fed’s QE lifted real GDP growth via the wealth effect by more than 75 basis points on a cumulative basis by year-end 2013. This is not quite three-quarters of the total estimated increase in real GDP due to the Fed’s QE programs.
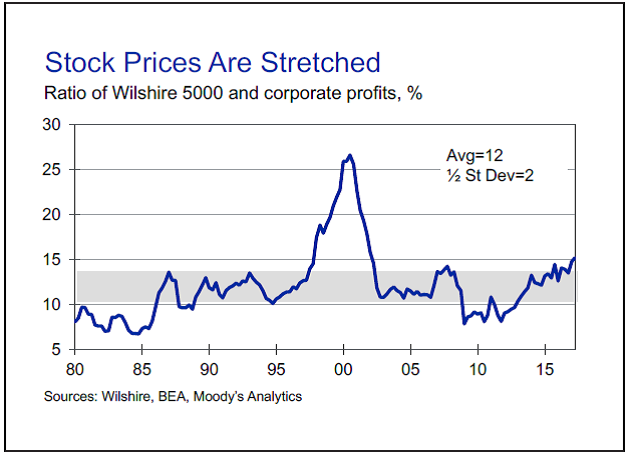
With the Fed now winding down its QE and the prospects for higher interest rates, risks are rising that asset prices will come under pressure, and the wealth effect fades or—even more serious— weighs on economic growth. With stock prices at record highs, and most measures of stock valuation stretched, there is a real threat of a significant and persistent decline in stock prices.

To see how serious this is, consider that a once-and-for-all decline in stock prices of 10%, consistent with a typical garden-variety stock market correction, would ultimately reduce real GDP by about 70 basis points via the wealth effect. A sustained 20% decline, consistent with a bear market, would result in an economy that is barely growing and at risk of sliding into recession.
The risk of a decline in house prices is much lower, but given that housing in some parts of the economy also appears overvalued relative to incomes and rents, there is a growing possibility that house price growth will slow meaningfully.
The American consumer is key to the U.S. expansion and, given our large trade deficit, the entire global economy. Fortunately, consumers are enjoying significant tailwinds—from a stronger job market to low debt loads, and easier credit. However, it is critical that stock and housing values hold their own. The wealth effect is powerful, and declining stock or housing prices could quickly overwhelm all the positives now powering consumer spending. This isn’t the most likely outlook, but it bears close watching.
About the Author:
 Mark M. Zandi is chief economist of Moody’s Analytics, where he directs economic research. Moody’s Analytics, a subsidiary of Moody’s Corp., is a provider of economic research, data, and analytical tools.
He is a co-founder of Economy.com, which Moody’s purchased in 2005.
Dr. Zandi conducts regular briefings on the economy for corporate boards, trade associations, and policymakers at all levels. He is often quoted in national and global publications and interviewed by major news media outlets, and is a frequent guest on CNBC, NPR, CNN, Meet the Press, and various other national networks and news programs.

